Netze BW GmbH, located in Stuttgart, Germany, operates the gas supply of the whole region Mittlerer Neckar. The overall length of the network is 6000km and comprises all pressure levels from high pres…

IT Security
04.07.2022
Network topology and geospatial network visualization as major enhancements to an existing system – Learn more about the story behind
IT Security
22.03.2022
Starting into digitization with fast solutions on today’s World Water Day
Today is World Water Day! The United Nations warns of a global water crisis on the occasion of increasing droughts and flood disasters, because climate change clearly affects our probably most importa…
Latest
18.03.2022
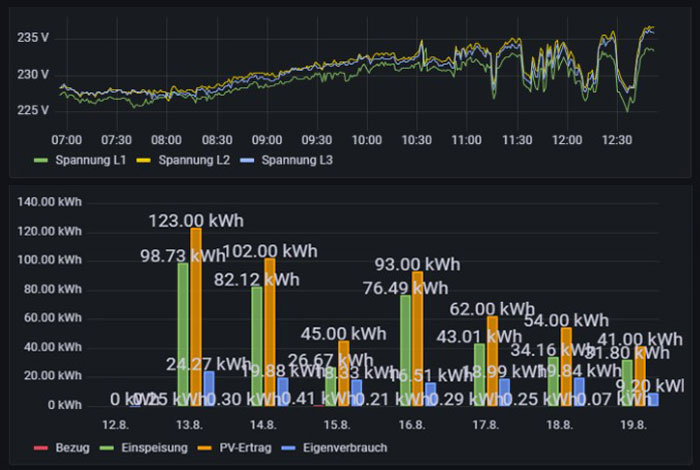
Data will become precious as gold – Make faster decisions thanks to VIVAVIS Dashboard
New ways of generating and distributing energy demand for new approaches to guarantee reliable and secure power supply. Thus, integrated acquisition and visualization of data relevant for decision-mak…
News Blog
18.03.2022
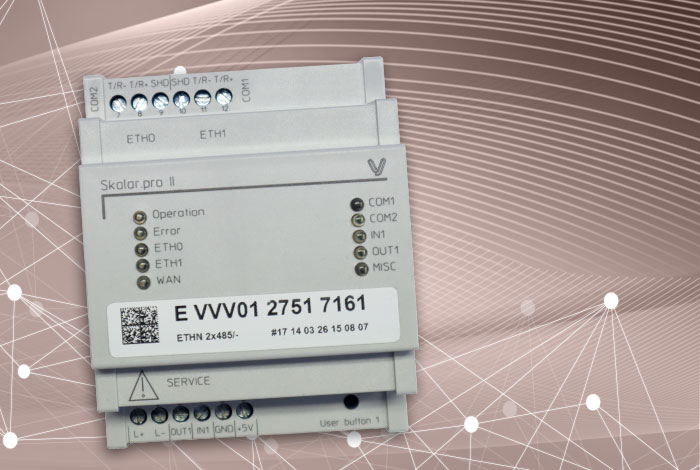
NEW! Skalar.pro II DR – maximum flexibility for customer applications
Requirements placed on monitoring and controlling combined heat and power stations (CHP) and plants in accordance with German law (EEG) have been steadily increasing over the last few years. The numbe…


